
Introduction
ABS (Acrylonitrile-Butadiene-Styrene) and PC-ABS are two plastics that appear everywhere — from consumer products to industrial components. ABS is widely used on its own, while PC-ABS is a blend that combines ABS with Polycarbonate (PC) to improve toughness and heat resistance.
On paper, these materials are clearly different. In practice, however, they can sometimes look and behave quite similarly, especially if you’re only examining them visually or mechanically at room temperature.
In this short study, I wanted to answer a simple question:
Can we characterise and show the differences between these two plastics using techniques commonly found in the materials science laboratory?
To explore this, I used three standard techniques:
- ATR-FTIR spectroscopy
- Differential Scanning Calorimetry (DSC)
- Dynamic Mechanical Analysis (DMA)
Rather than focusing on complex theory, this blog looks at what these techniques reveal in a straightforward and practical way.
ATR-FTIR: Chemical Fingerprints of Plastics
ATR-FTIR (Attenuated Total Reflectance – Fourier Transform Infrared Spectroscopy) is a widely used technique in the materials science laboratory for identifying polymers. In simple terms, it works by shining infrared light onto a material and measuring which wavelengths are absorbed by the material. Different chemical bonds absorb infrared light at different wavelengths, so the resulting spectrum acts like a chemical fingerprint of the material. The following FTIR analysis was carried out on a Bruker Lumos FTIR microscope#
ABS vs PC-ABS spectra
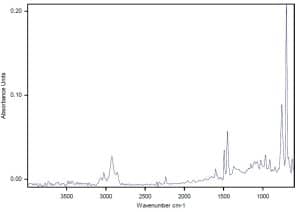
ABS has a well-known and distinctive FTIR spectrum, dominated by signals from: Styrene, Acrylonitrile, Butadiene. The Spectrum for ABS is shown below:
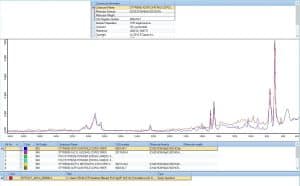
Using the software, we can perform a search the above spectrum against a library in order to determine exactly what it is. The Spectral match is shown below:
Likewise, the spectrum for PC-ABS is shown in the image below:
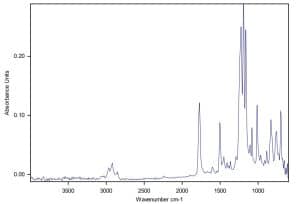
A similar library search would reveal a copolymer of the ABS type. As we can see, many of the peaks that are present in the spectrum for ABS are also present in that of PC-ABS as we would have expected. We know that the additional peaks must be from the Polycarbonate (PC) phase, but is there a way we can show this if we already have the spectrum for the ABS on it’s own? As it happens there is: spectral subtraction.
In simple terms, this involves:
- Taking the FTIR spectrum of ABS
- Subtracting it from the FTIR spectrum of PC-ABS
- Examining what remains and searching this against the library database
An easy way to think about this is like removing a loud instrument from a piece of music so you can hear the quieter sounds underneath. Once the ABS contribution is mathematically removed, the remaining features correspond closely to known polycarbonate absorption bands, particularly those associated with carbonate groups. This provides clear chemical evidence that PC-ABS contains polycarbonate and also that the blend is not chemically uniform but made up of distinct polymer components. Below is an image of the subtracted spectrum, searched against the library database:
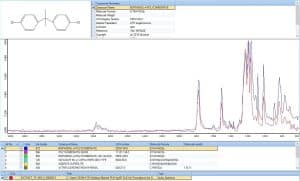
As can be seen, the library search indicates that the subtracted peaks are consistent with polycarbonate. As an additional note, the ‘bis-phenol’ part refers to a chemical from which the vast majority of polycarbonates are manufactured.
DSC: Watching Plastics Soften with Heat
Differential Scanning Calorimetry (DSC) is a thermal analysis technique which measures how much heat a material absorbs or releases as it is heated or cooled. One of the most useful features observed in DSC is the glass transition temperature (Tg) for amorphous polymers and melting and recrystallization peaks for semi-crystalline polymers. The glass transition marks the temperature range where a polymer changes from a rigid and glass-like to softer and more rubber-like state.
ABS: One glass transition
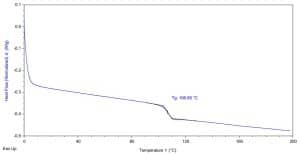
When ABS is analysed by DSC, it typically shows a single Tg, representing the transition of its polymer matrix. A thermograph for the ABS is shown below and as can be seen, we see one glass transition at approximately 106 oC. This was performed on a TA Instruments Discovery series DSC (DSC 250).
PC-ABS: Two glass transitions
PC-ABS, by contrast, shows two distinct Tg values. This is a key observation -the presence of two glass transitions suggests:
- Two different polymer phases are present
- Each phase softens at a different temperature
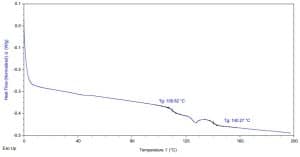
In this case one Tg corresponds to the ABS phase and the second Tg corresponds to the polycarbonate phase, which is consistent with the fact that PC-ABS is a physical blend rather than a single, fully miscible material. A thermograph for PC-ABS is shown below. Notice the two glass transitions – one from the ABS and the other from the polycarbonate phase:
DMA: Mechanical Behaviour Confirms the Picture
Dynamic Mechanical Analysis (DMA) looks at how a material responds to a small, sinusoidal force as temperature changes (heat ramp). Instead of measuring heat flow, DMA measures:
- Stiffness
- Damping
- Mechanical transitions (e.g., glass transition)
As polymers approach their glass transition, their stiffness decreases and energy dissipation increases therefore DMA is a valuable tool which can be used to identify glass transition, however this is only one example of what a DMA can do. The following tests were carried out on an Netzsch Eplexor DMA 303. In terms of the two materials under study here, what DMA shows:
For ABS:
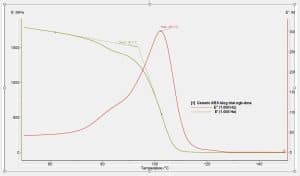
A single dominant transition is observed. This aligns with the single Tg seen in DSC. This can be seen in the image below.
For PC-ABS:
Two transitions (or a broadened response) can be detected which correspond to the ABS-rich and polycarbonate-rich phases. This can be seen in the image below:
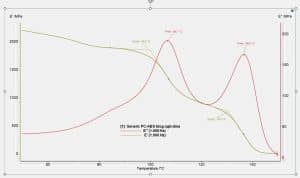
Notice the two drops in what is known as the storage modulus at approximately the same temperatures as those from the DSC. The slight differences can be explained by the fact that a different PC-ABS sample was used for the DMA testing, but the important point is that we can clearly identify two glass transitions.
DMA doesn’t introduce a new story — it reinforces what DSC already suggested. The beauty of DMA is that if a glass transition is difficult to see in DSC, it will be much more obvious in DMA. Also there is a general guideline: if a glass-transition cannot be seen in DMA, then the material has no glass-transition. In the PC-ABS above, the material behaves mechanically as a blend of two polymers, each with its own transition temperature.0*
Applied Polymer Characterisation at SEAM
This study demonstrates how common laboratory techniques, when applied correctly, can clearly differentiate between polymer systems that may appear similar in practice. Techniques such as ATR-FTIR, DSC, and DMA provide complementary chemical, thermal, and mechanical insights that are essential for accurate materials identification and performance assessment.
At SEAM Research Centre, SETU Waterford, we support industry and research partners with advanced materials characterisation, polymer analysis, failure investigation, and applied R&D using state-of-the-art laboratory and imaging facilities.
If you are working with polymers, composites, or engineered materials and need practical, data-driven insight to support product development, quality assurance, or failure analysis, our team would be delighted to discuss how SEAM can support your project.
This Blog was written by Shane Walsh , Materials Research Assistant at SEAM